02806 Social Data Analysis: Final Assignment - Group X
Table of Contents
Introduction
For this project, we chose to work with the Global Terrorism Database (GTD) — one of the most comprehensive open-source datasets on terrorist activity worldwide. It contains detailed information on more than 200,000 terrorist incidents from 1970 to 2020, including data on the type of attack, location, casualties, weapons, perpetrators, and other critical attributes.
We selected this dataset for two reasons: first, terrorism is a topic with deep geopolitical, social, and humanitarian impact, and visualizing its trends helps build understanding of global and regional conflict dynamics. Second, the richness of the GTD makes it suitable for diverse forms of analysis and storytelling, including both quantitative trends and human-centered consequences.
Our goal was to design a visually-driven experience that allows users to:
- Observe temporal and regional trends in terrorism,
- Understand the tactics and impact of attacks over time,
- Explore connections between perpetrators, weapons, and victims.
We divided the project into three complementary perspectives:
- Incident and Attack (structure, type, and evolution of events)
- Victims and Consequences (casualties and human cost)
- Weapons and Perpetrators (means and motives of terrorism)
Analysis
This section presents the analysis of data.
Incident + attack
Attacks per day
This calendar visualization provides a clear, high-level view of the evolution in the frequency of terrorist attacks over time. In the early 1970s, the dataset shows relatively low daily attack counts, suggesting that terrorism was less frequent or less systematically recorded during that period. Moving into the 1980s, occasional spikes begin to appear, indicating an uptick in both the occurrence and visibility of attacks.
The trend remains fairly consistent throughout the 1990s, but in the months leading up to September 11, 2001, there’s a noticeable increase in daily incidents. Interestingly, following the 9/11 attacks, there is a sharp drop in the frequency of attacks, which persists until around 2006–2007. This period of reduced activity may reflect increased global counterterrorism efforts or shifts in reporting.
Beginning in 2012, the number of attacks rises dramatically, peaking in 2014—a year that aligns with the height of ISIS activity and unrest in the Middle East. After 2017, the frequency of attacks begins to decline again, suggesting a potential de-escalation or success in counterterrorism efforts in some regions.
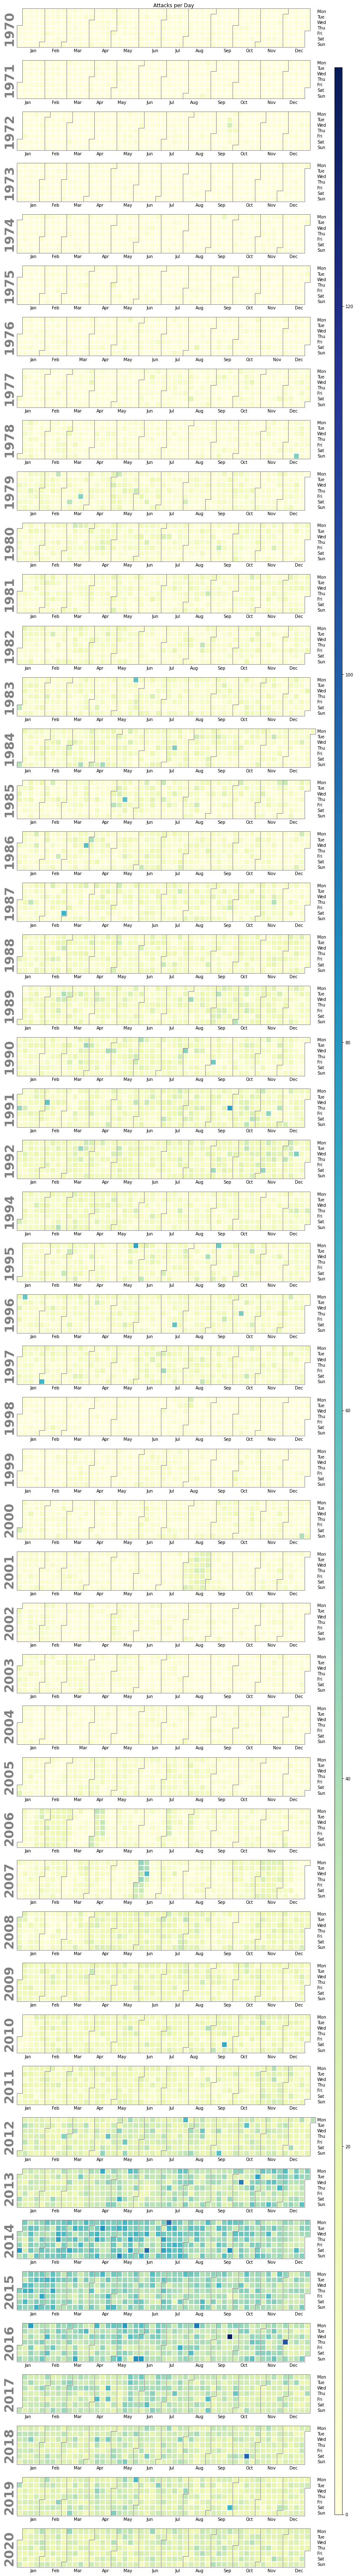
Figure 1: Attacks per day. Overall, the calendar format effectively highlights temporal patterns and significant turning points in global terrorism trends.
Heatmap with time series
This heatmap provides a dynamic visualization of the geographic distribution of terrorist attacks over time. One of the most striking patterns is the apparent underreporting or lack of data in the first two decades of the dataset—particularly in regions like Central Africa. Given that this region later emerges as one of the most active in terms of attacks, the early absence likely reflects data limitations rather than a true lack of activity.
Over the years, the intensity and location of attack concentrations fluctuate, but several regions consistently appear as hotspots. These include parts of Europe, the Middle East, a broad belt stretching across Central Africa (from west to east), Southeast Africa, the northern edge of South America, and a swath of South Asia spanning from Afghanistan to Malaysia—including the Philippines.
In addition to these persistent hotspots, the heatmap reveals smaller, time-bound concentrations of activity corresponding to localized conflicts. Examples include South Korea before the 2000s, Northern Ireland during the Troubles, Spain during the height of ETA activity, and Chile during the Pinochet regime. These regional spikes align with well-documented historical and political events, highlighting the value of temporal heatmapping in uncovering context-specific patterns in global terrorism trends.
Figure 2: Heatmap with time series.
Attack types and successful rate
Bombing/Explosion is the most common type of attack. This is not surprising given the effectivity of a bomb against humans and infrastructure plus it can be done remotely.
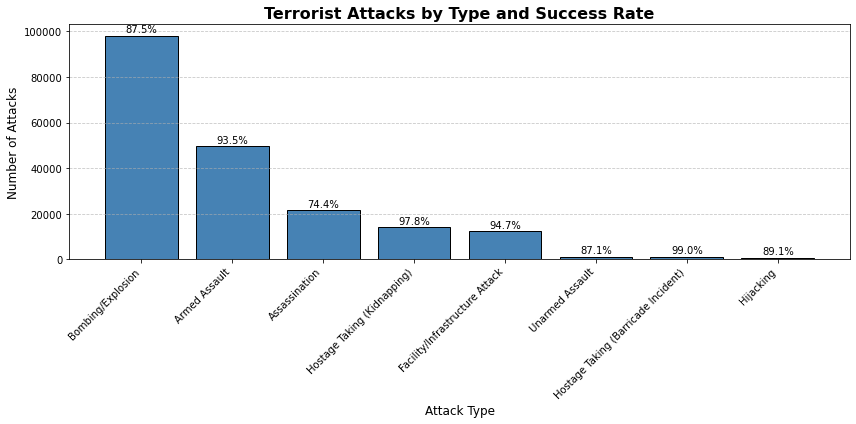
Figure 3: Attack types and successful rate.
Regions involved
This set of plots captures both the temporal and regional heterogeneity of terrorism globally. It reveals how terrorism has shifted in focus over time, with some regions becoming more volatile in recent decades. The peak year trends also suggest links to major geopolitical shifts, civil conflicts, and insurgent activities.
-
Middle East & North Africa stands out with the highest peak of attacks, particularly during the early 2010s. The intense yellow tone in this plot highlights that the region experienced the most concentrated period of violence globally, peaking around 2014–2015.
-
South Asia and Sub-Saharan Africa also show high activity, with steep increases starting in the late 2000s and sharp peaks afterward. South Asia’s curve is steep and sustained, indicating prolonged conflict intensity.
-
Southeast Asia, Central Asia, and South America exhibit mid-level peaks (orange to pink shading), suggesting regional but less globally dominant spikes in violence, often tied to specific insurgencies or political unrest.
-
Western Europe and North America show more episodic patterns — brief but sharp spikes in attacks (e.g., IRA in the UK or domestic terrorism in the US) but overall lower sustained intensity compared to conflict-heavy regions.
-
Eastern Europe and East Asia show relatively subdued activity, both in terms of frequency and intensity, reflected by darker tones and flatter curves.
-
Central America & Caribbean, despite having moments of activity, never reach the same peaks as other regions, indicating more localized or less frequent terrorist incidents.
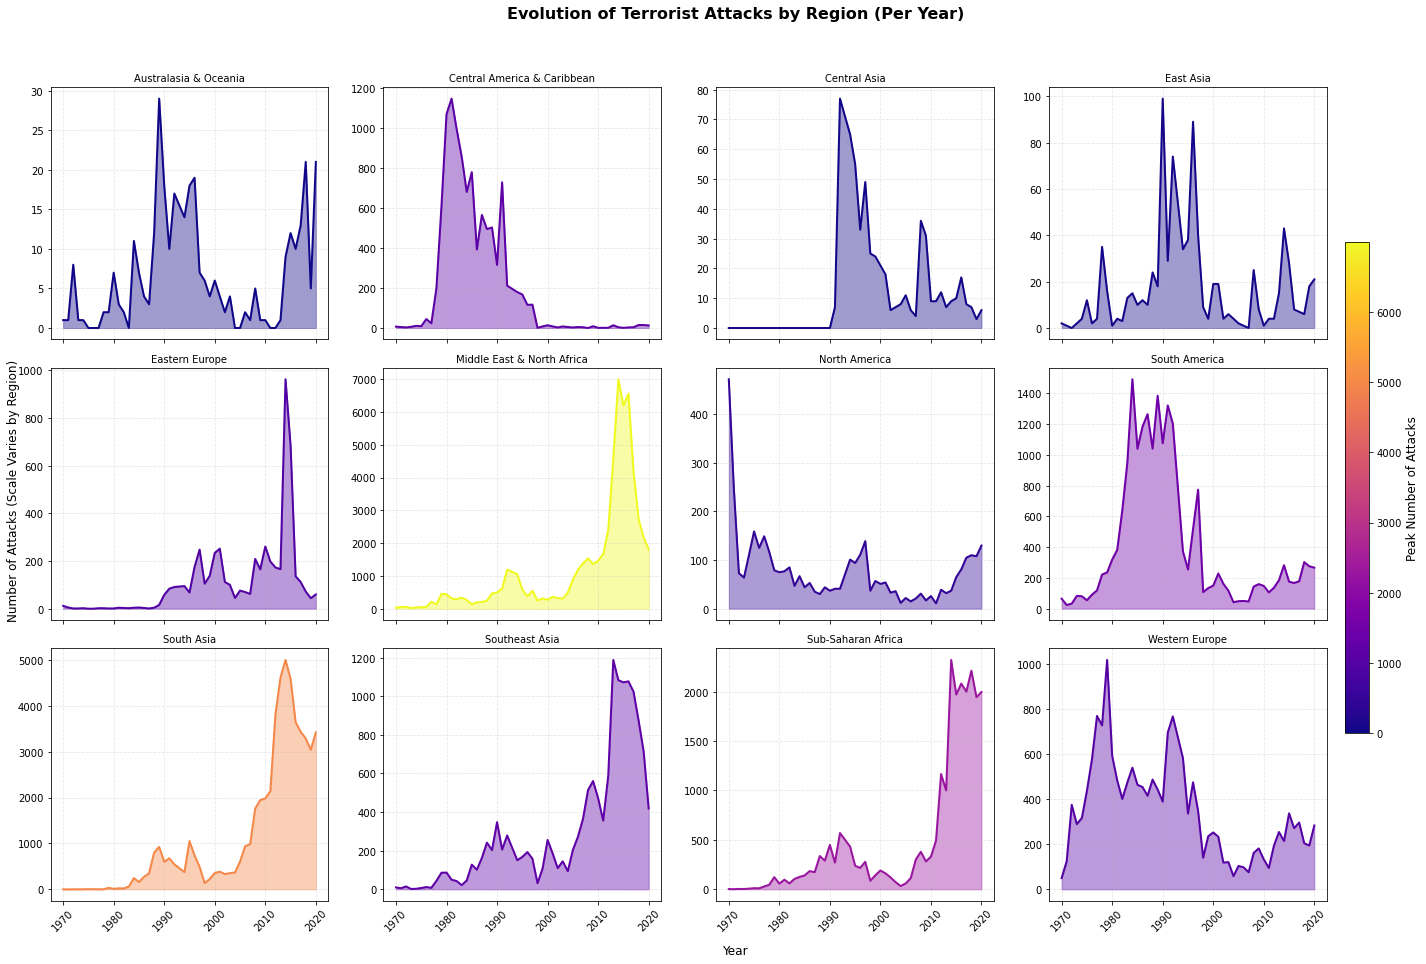
Figure 4: Regions involved.
Victim + casualties and consequences
Victim types
This bar chart displays the top 10 victim types most frequently affected by terrorist attacks. The data reveals that Private Citizens & Property are the most affected group, with over 50,000 recorded victims, nearly double that of the next type, Military. Other highly impacted types include Police and Goverment(Diplomatic and General).
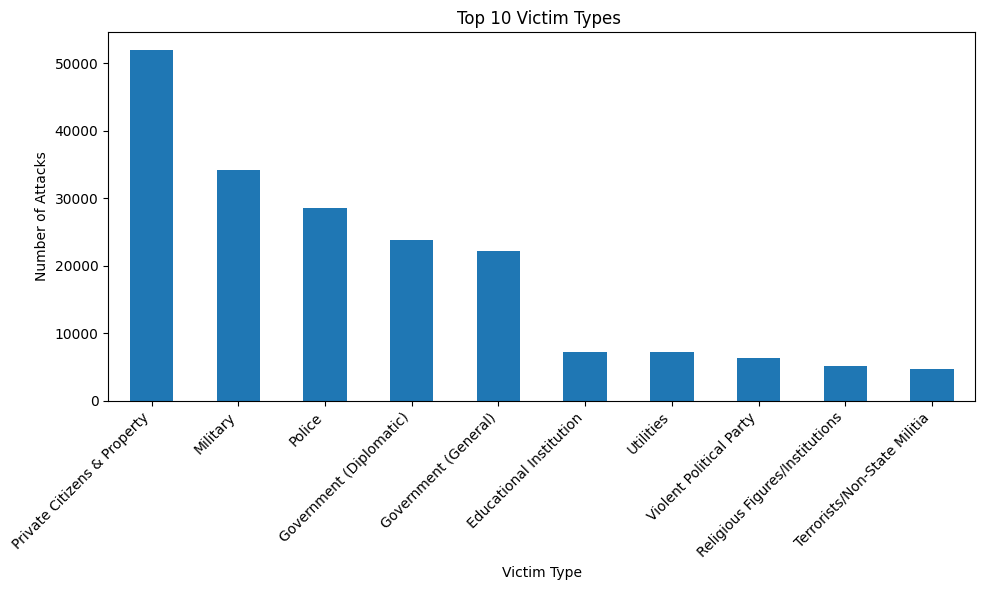
Figure 5: Bar Chart of victim types.
Consequences of attacks
This chart reveals the tremendus effects of terrorist attacks, comparing the number of fatalities and injuries recorded. The data reveals that nearly 580,000 people were injured due to terrorist attacks, but more importantly, approximately 480,000 humans lifes were lost. These statistics reveal the deadly nature of these incidents, were 45,3% of the total victims lose their lifes.
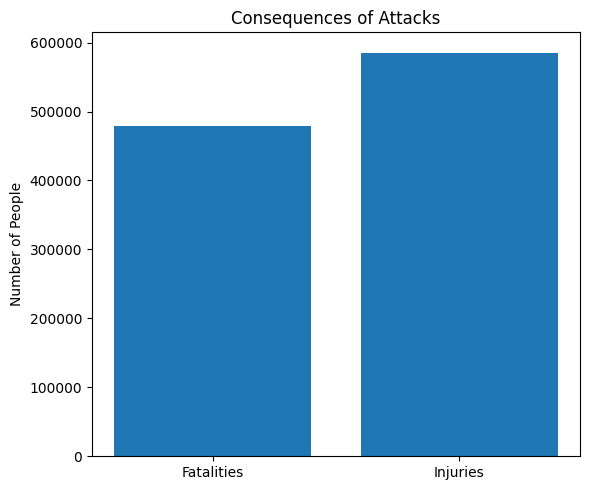
Figure 6: Bar Chart of Consequences of attacks.
Fatalities and Injuries by victim type
These three visualizations provide a detailed look at the human cost of terrorism accros different victim types.
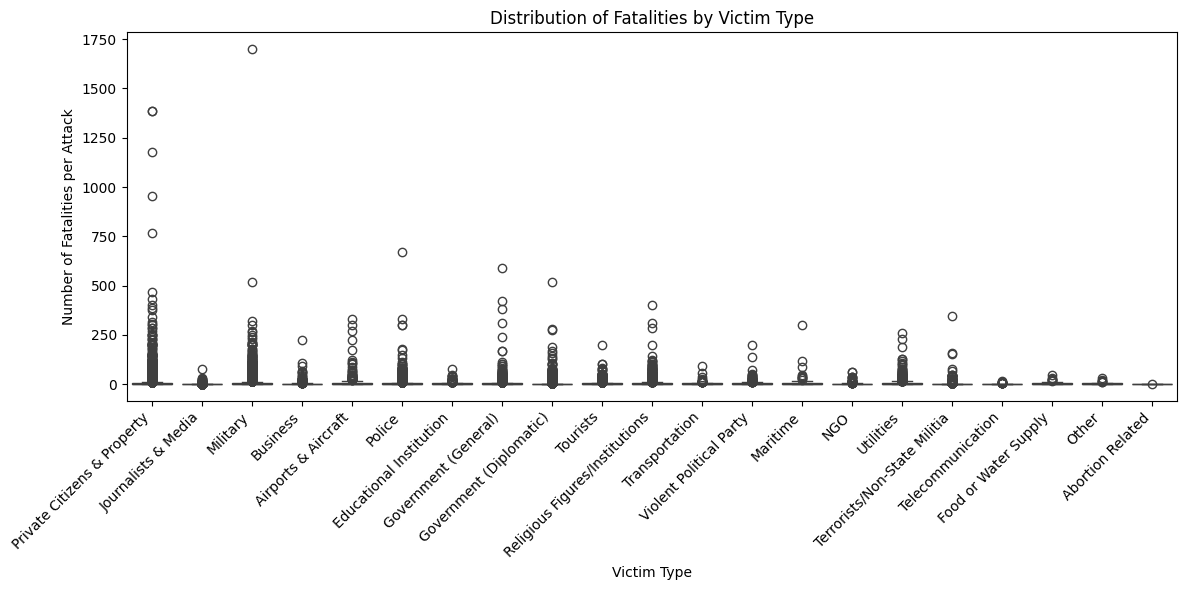
Figure 7: Scatterplot of fatalities distribution by victim type.
- The distribution of fatalities per attack, revealing Privite Citizens & Property, Military and Police as the clear outliers.
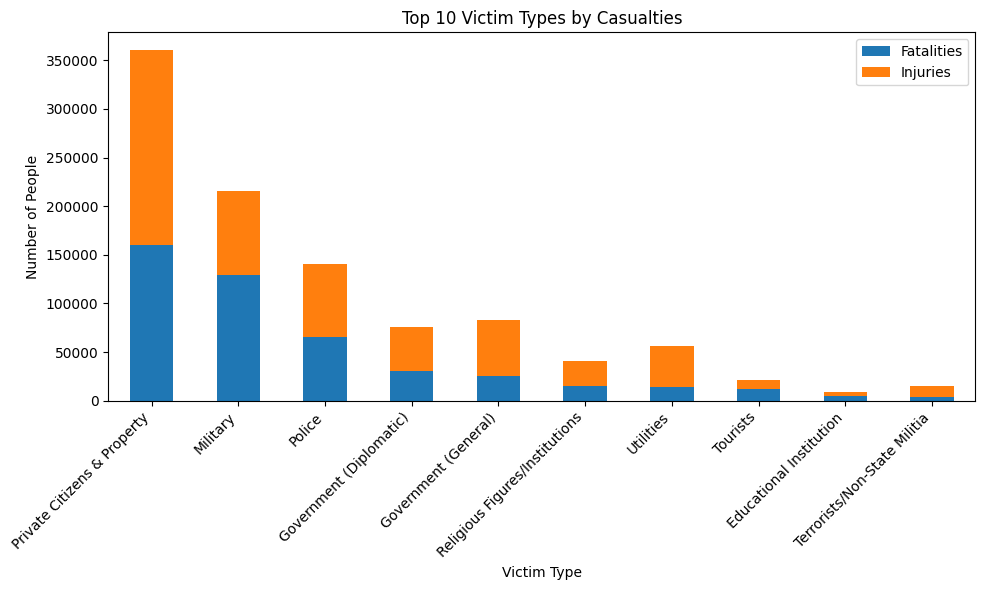
Figure 8: Stacked Bar Chart of the top 10 victim types by casualties.
- The total impact of terrorist attacks by victim types, combining fatalities and injuries. This chart further confirms that Privite Citizens are the most affected group by a wide margin.
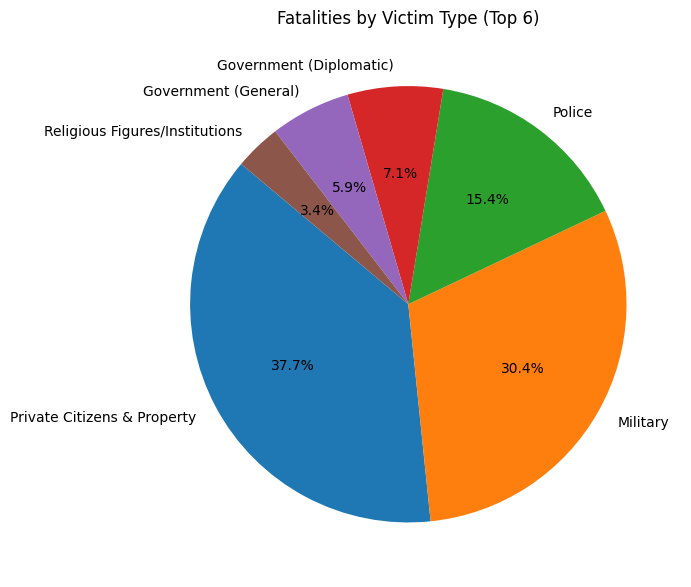
Figure 9: Pie Chart of top 6 victim types by fatalities.
- The pie chart offers a proportional breakdown of fatalities among the top six victim types. Together, these graphs reveal the discomforting truth: while terrorism is often politically driven, most of the victims belong in the general population.
Fatalities by region and victim type
This heatmap provides a regional breakdown of fatalities caused by terrorist attacks, segmented by victim type. The most affected types of victims are consistently Privite Citizens, followed by Police and Military, while the most active regions are Sub-Saharan Africa, South Asia and Middle East & North Africa.
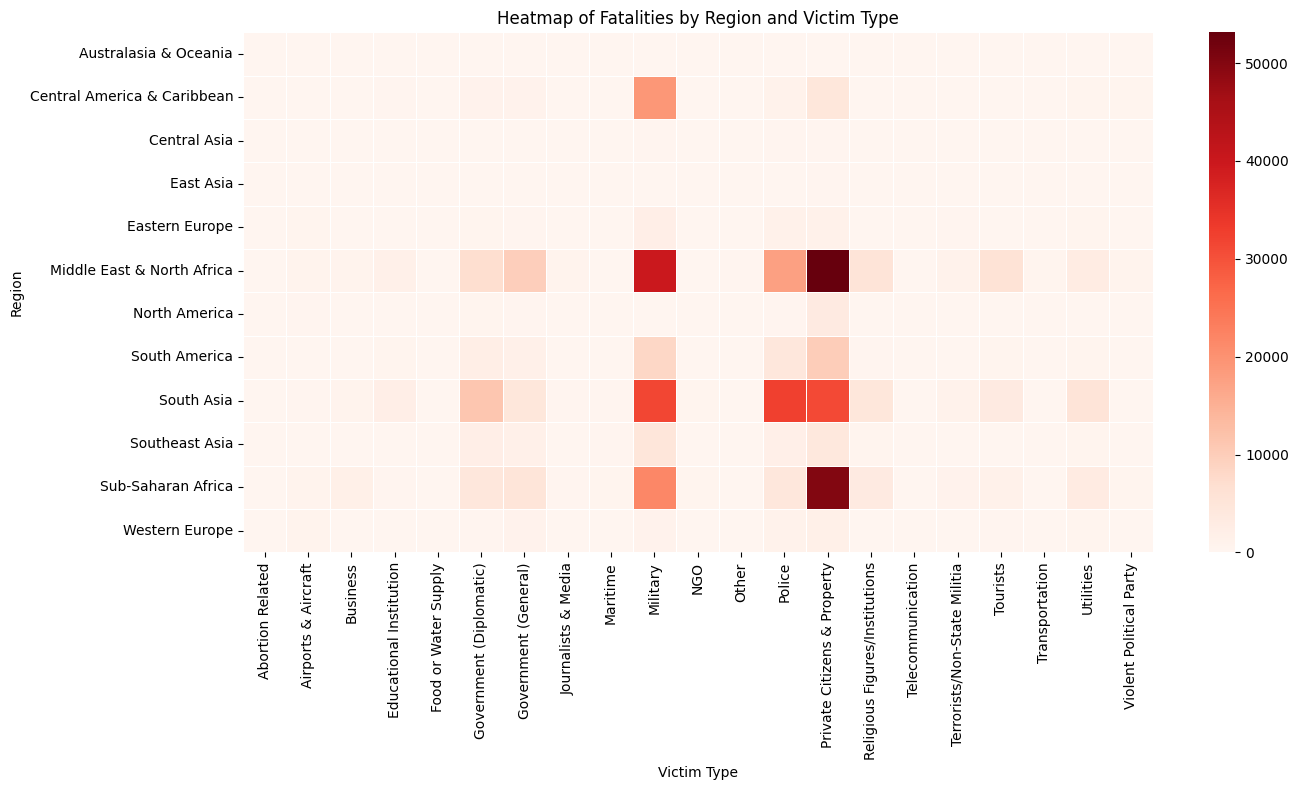
Figure 10: Heatmap of fatalities by region & victim type.
Weapon + perpetrator
Top Terrorist Groups
Each bar in the chart represents a specific terrorist group, and the length of the bar corresponds to number of incidents associated with that group.
- Terrorist Group: The y-axis (vertical axis) lists the names of various terrorist groups.
- Numerical Value: The x-axis (horizontal axis) represents the number of incidents associated with each terrorist group.
- Excluding “Unknown”: Groups labeled as “Unknown” were excluded from the data, so that relevant group names are displayed.
The chart shows that the Taliban has the highest number of incidents (11,982), far more than any other group in the top 20. ISIL follows with 7,254 incidents, and Shining Path (SL) is third with 4,564. After the top three, there’s a drop-off, with the remaining groups showing a more gradual decline. The Communist Party of India - Maoist (CPI-Maoist) is among those with the fewest incidents in the top 20.
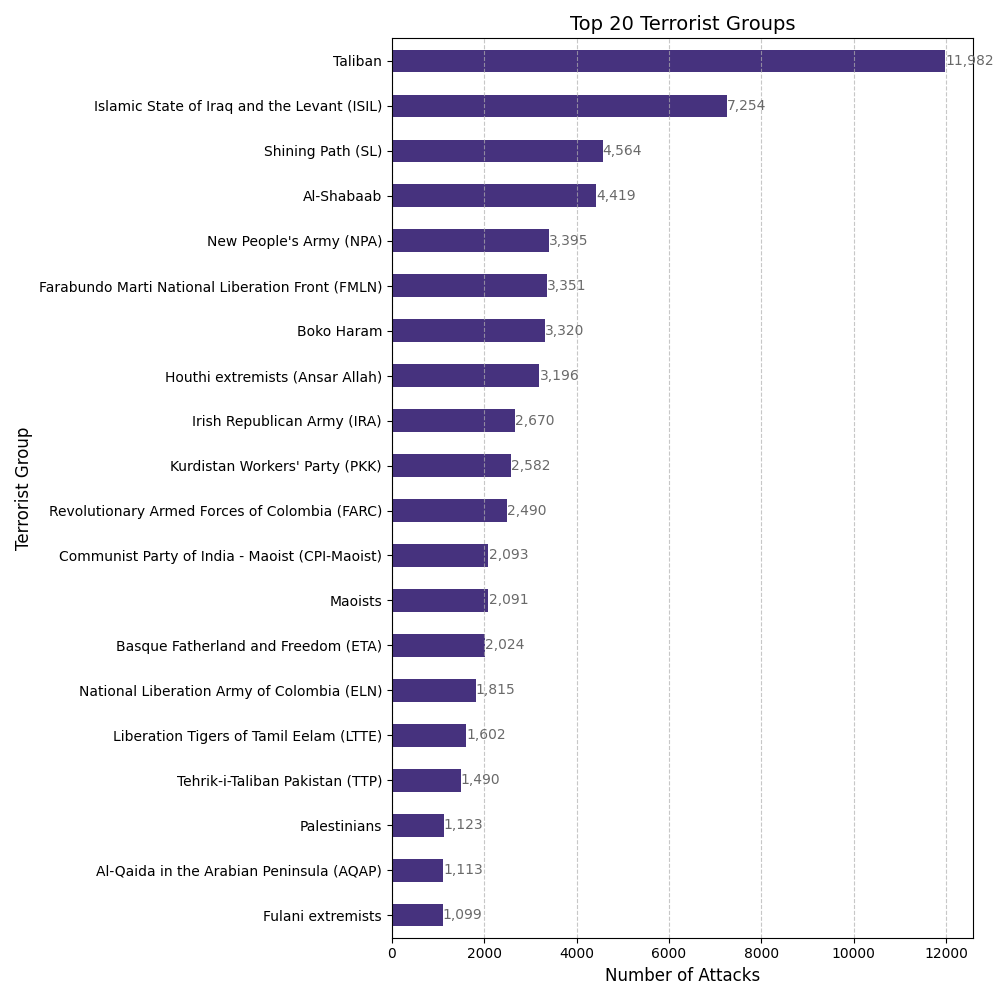
Figure 11: Top Terrorist Groups.
Top Weapon Types
The chart illustrates the distribution of weapon types employed in the reported attacks. Less frequent weapon types have been aggregated into an “Other” category to enhance clarity. The chart facilitates a comparative analysis of the prevalence of different weapon categories.
- Explosives represent the most substantial proportion, accounting for 49.3% of the attacks. This indicates that explosive devices were the predominant weapon type in the dataset.
- Firearms were the second most frequently utilized weapon, observed in 32.3% of the attacks.
- A notable proportion, 9.6%, of attacks were carried out with Unknown weapon types. This introduces an element of uncertainty into the analysis.
- Less frequently utilized weapon types, such as Incendiary and Melee weapons, constitute only minor proportions of the total.
- The “Other” category represents a negligible fraction of the attacks.
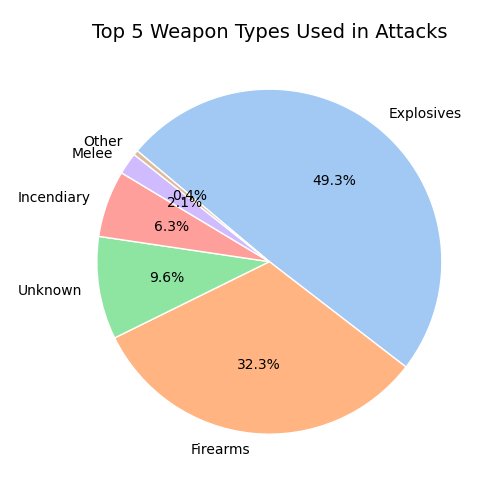
Figure 12: Top Weapon Types.
Top Weapon Sub-types
The chart presents a categorical breakdown of weapon sub-types and their corresponding frequencies of use in reported attacks. The x-axis represents the number of attacks, while the y-axis enumerates specific weapon sub-types. The bars are arranged horizontally, allowing for a comparative assessment of the prevalence of each sub-type.
- The weapon sub-types with the highest frequency of use are “Unknown Explosive Type” and “Unknown Gun Type,” with 48,807 and 40,783 attacks, respectively. The substantial number of attacks attributed to these unknown categories suggests a significant gap in data granularity, which may warrant further investigation.
- Among known weapon sub-types, “Automatic or Semi-Automatic Rifle” is the most prevalent, with 18,176 attacks. This indicates the frequent use of this weapon category in violent incidents.
- “Projectiles (rockets, mortars, RPGs, etc.)” and “Vehicle” also exhibit relatively high frequencies, with 12,031 and 10,849 attacks, respectively.
- The remaining weapon sub-types, including “Other Explosive Type,” “Handgun,” “Grenade,” and others, show a progressive decline in frequency of use.
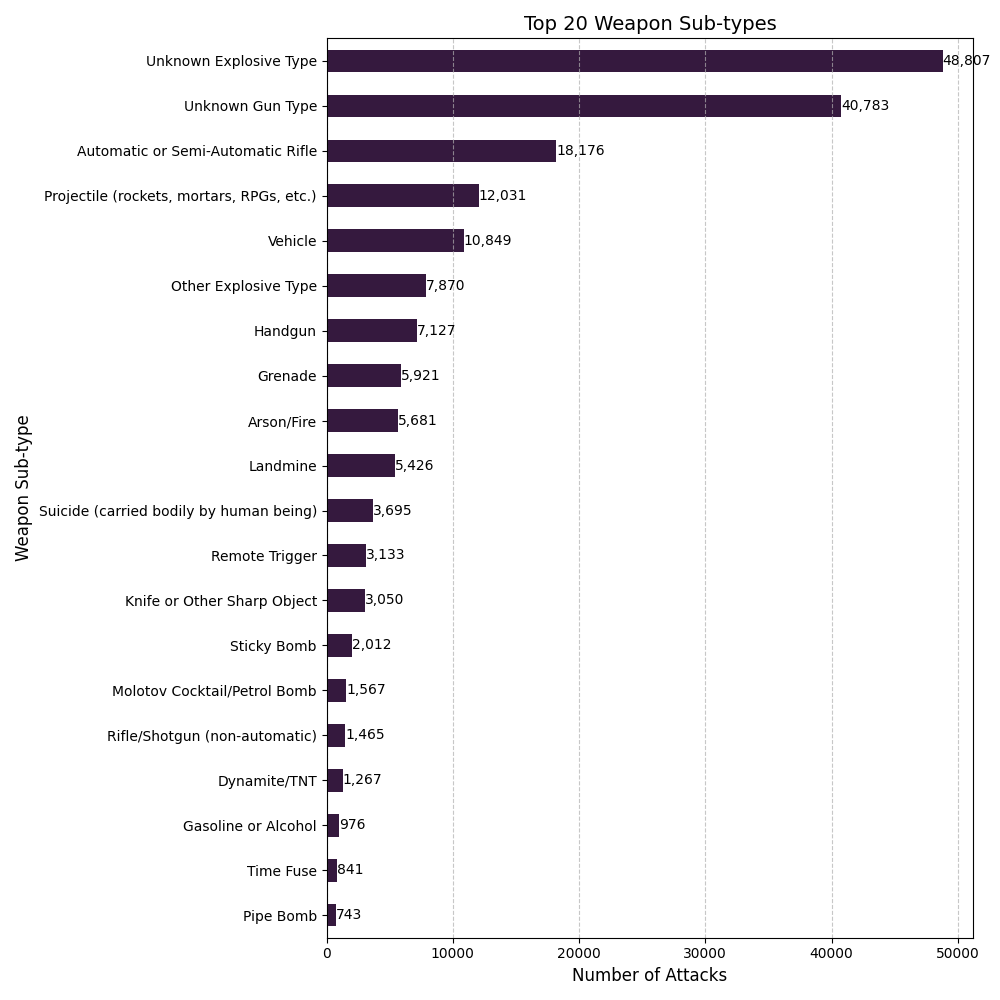
Figure 13: Top Weapon Subtypes.
Word Cloud of Weapon Sub-types
The image presents a word cloud visualization displaying various weapon sub-types. The size of each word is proportional to its frequency of occurrence within the dataset. This visualization provides a qualitative overview of the most frequently mentioned weapon sub-types.
- Terms such as “rifle,” “gun,” and “explosive” appear prominently, suggesting their prevalence in the data.
- Additional observations include the presence of terms like “vehicle,” “projectile,” and “grenade,” indicating their relevance within the dataset.
- It is important to note that the word cloud does not contain “Unknown” weapon types, as these were excluded from the analysis. This exclusion allows for a clearer focus on the distribution of known weapon sub-types.
Figure 14: Word Cloud of Weapon Types.
Weapon Types Over Time
The dynamic bar chart illustrating how the usage of different weapon types varies over time. Year 1993 is filtered out, because it has no data.
- Dynamic Interaction: The chart is interactive. You can hover over the bars to see the exact count and weapon type for a specific year.
- Time Slider: A slider allows you to adjust the year, enabling you to observe changes in weapon type usage across different years.
A notable trend observed throughout the years is the prevalence of Explosives, which consistently shows a high number of incidents, making it the most frequently used weapon type. Firearms typically follow as the second most common, while Incendiary weapons and, to a lesser extent, Melee weapons also appear with some regularity. Other weapon types such as Chemical, Sabotage Equipment, Fake Weapons, Radiological, Biological, and Other tend to be used much less frequently across the time period represented in the data.
Figure 15: Weapon Types Over Time.
Top Perpetrator Groups Over Time
This graph illustrates how the number of attacks attributed to the top 10 perpetrator groups has changed across different years. Unknown group is skipped to increase clarity.
- Dynamic Interaction: The graph is interactive. You can hover over the lines to see the exact number of attacks and the corresponding year for each group.
- Trend Visualization: The lines represent the trend for each perpetrator group over the years, allowing you to observe how their activity increases or decreases.
- Comparative Analysis: By plotting multiple groups on the same graph, it enables a comparison of their activity levels and trends.
The graph shows how the activity of different perpetrator groups has evolved over time. For example, you can observe the rise and fall of attacks by groups like the Irish Republican Army (IRA) and the Kurdistan Workers’ Party (PKK) over the decades. Additionally, the graph highlights the emergence and surge in activity of groups like ISIL in more recent years. The Taliban, however, shows a noticeable presence throughout the entire period with varying levels of activity.
Figure 16: Top Terrorist Groups Over Time.
Conclusion
Terrorist attacks are a worldwide phenomenon, usually related to political causes, yet the most afflicted type of victims, by a large margin, is private citizens. Even though the main targets are governments and political authorities, attacks overwhelmingly impact civilians, as proved undeniably by the data. The main reason for the large number of these unfortunate casualties lies within the categories of weapon used by terrorists. Almost half of all terrorist attacks are performed using explosives like IEDs and airstrikes, causing widespread harm due to their indiscriminate nature.[1][2][3][4]
References
- HRW: Explosive Weapons in Populated Areas
- OCHA: Explosive Weapons in Populated Areas
- TheGuardian: Civilian casualties of explosive weapons at highest level in more than a decade
- INEW: Implementing the political declaration on explosive weapons in populated areas: questions and answers
- Global Terrorism Database (GTD)